

An asset class comparison
Drew O’Neil discusses fixed income market conditions and offers insight for bond investors.
For many investors, fixed income is intended to serve as the ballast of a portfolio. This means that it hopefully provides stability in turbulent times while providing consistent and known income, cash flow, and return of principal. As high-quality fixed income investments are generally the more conservative portion of a portfolio, it stands to reason that expected returns, on average and over long periods of time, are going to be lower than investments with a growth objective. More risk should equal more reward and vice versa.
Although maximizing total return is not usually the primary objective of a fixed income portfolio, analyzing total returns in various market environments is a useful exercise for investors to help reinforce how various asset classes can play a role in a portfolio. When thinking about fixed income being targeted for wealth preservation and to act as a stable force in stormy weather, the numbers in the chart below shine some light on performance during years when returns are negative as well as returns when the economy is in a recession. The chart also provides a comparison to equities, which for many investors is their primary vehicle for growth.
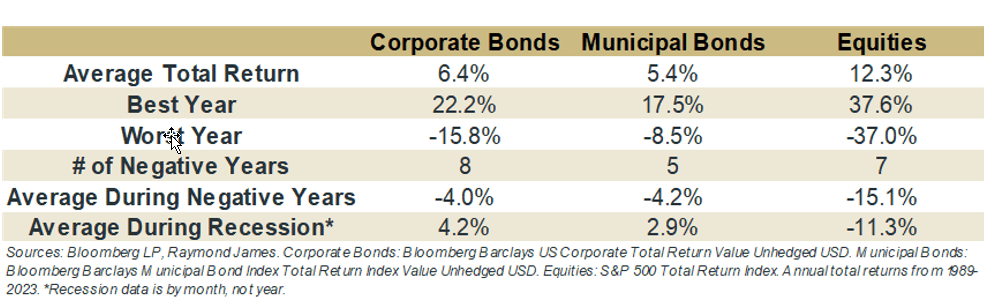
First, looking at the average total returns of corporate bonds, municipal bonds, and equities, the results look as you would expect given the risk profiles of each respective asset class. Since 1989 the S&P 500 Total Return Index has returned over 12% annually on average while both fixed income products have averaged a respectable ~5-6% annually. Looking at the worst year of each product, we see that when things go bad in the equity market, they can go very bad as their worst year since 1989 was a -37% total return (2008). Fixed income’s worst year over this timeframe was more recent, as 2022 delivered the largest negative results for both municipal and corporate bonds. More telling is the average during negative years. When fixed income has had a negative total return for the year, the return has been around -4%. When equities have a bad year, the average return is about -15%: when equities have a negative year, they tend to have substantial losses. This is not an attempt to shine a negative light on equities, it just highlights the role they play in the portfolio. Equities have a growth objective and with larger growth opportunities comes larger downside risks. Fixed income generally has a wealth preservation objective and with that, comes less potential upside. Essentially, from a historical perspective, both asset classes have done their job.
Markets are wavering back and forth as to whether or not a recession is coming in the near future. Regardless of which camp you are in, everyone can agree that a recession is coming eventually. It might be next quarter, next year, or in 10 years, but at the end of the day, recessions are part of the economic cycle and cannot be avoided forever. As you position your portfolio for the (eventually) coming recession, the bottom row provides some insights for what to expect. This data looks at average total returns during recessions. Both corporate and municipal bonds have positive average total returns over the past four recessions, at +4.2% and +2.9%, respectively. During recessions, equities have averaged -11.3%.
It is worth noting that recessions are generally short-lived relative to expansionary periods. The average length of the four recessions we have had since 1989 is just 10 months. From a fixed income perspective, investors with a long-term time horizon are generally buying high quality individual bonds and holding them for a long period of time that might extend over multiple recessions. For these investors, considering total returns over any short-term window might not be a useful exercise, as the longer-term prospects are the purpose of the allocation. Yet, while thinking long-term is the goal, it is human nature to track more immediate impacts and to follow short-term swings with anticipation of what might come next. Keeping in mind that past performance is by no means a guarantee of future performance, analyzing previous trends can help guide how we plan for the future and at a minimum, prepare us mentally for what might be around the corner.
The author of this material is a Trader in the Fixed Income Department of Raymond James & Associates (RJA), and is not an Analyst. Any opinions expressed may differ from opinions expressed by other departments of RJA, including our Equity Research Department, and are subject to change without notice. The data and information contained herein was obtained from sources considered to be reliable, but RJA does not guarantee its accuracy and/or completeness. Neither the information nor any opinions expressed constitute a solicitation for the purchase or sale of any security referred to herein. This material may include analysis of sectors, securities and/or derivatives that RJA may have positions, long or short, held proprietarily. RJA or its affiliates may execute transactions which may not be consistent with the report’s conclusions. RJA may also have performed investment banking services for the issuers of such securities. Investors should discuss the risks inherent in bonds with their Raymond James Financial Advisor. Risks include, but are not limited to, changes in interest rates, liquidity, credit quality, volatility, and duration. Past performance is no assurance of future results.
Investment products are: not deposits, not FDIC/NCUA insured, not insured by any government agency, not bank guaranteed, subject to risk and may lose value.
To learn more about the risks and rewards of investing in fixed income, access the Financial Industry Regulatory Authority’s website at finra.org/investors/learn-to-invest/types-investments/bonds and the Municipal Securities Rulemaking Board’s (MSRB) Electronic Municipal Market Access System (EMMA) at emma.msrb.org.

